
INTERACTION DESIGN
Designing interactions that feel intuitive, responsive, and quietly guide users without getting in their way.

Featured project
fable
A space for every film voice
An end-to-end concept for a taste-driven, social film app, from a 28-person survey and two personas through to information architecture, wireframes and final UI.
UX Research
Product Design
Mobile App
Design System
View Case Study

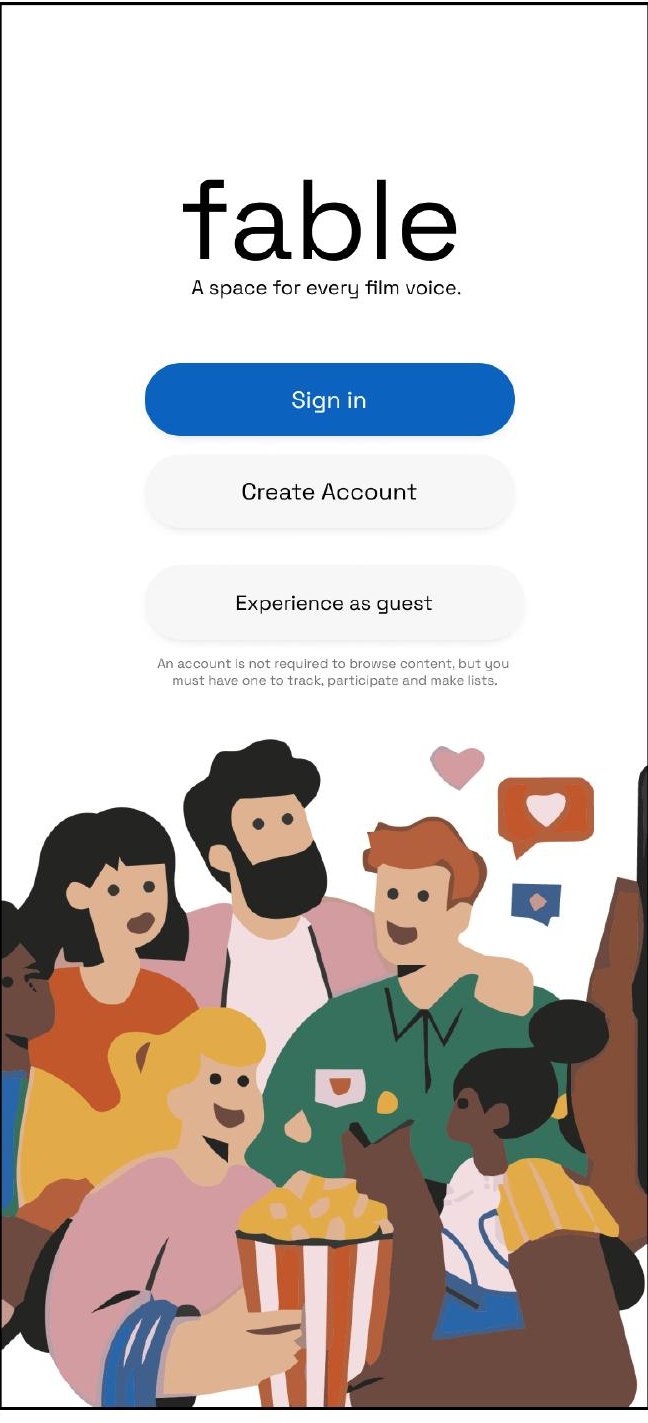
Welcome
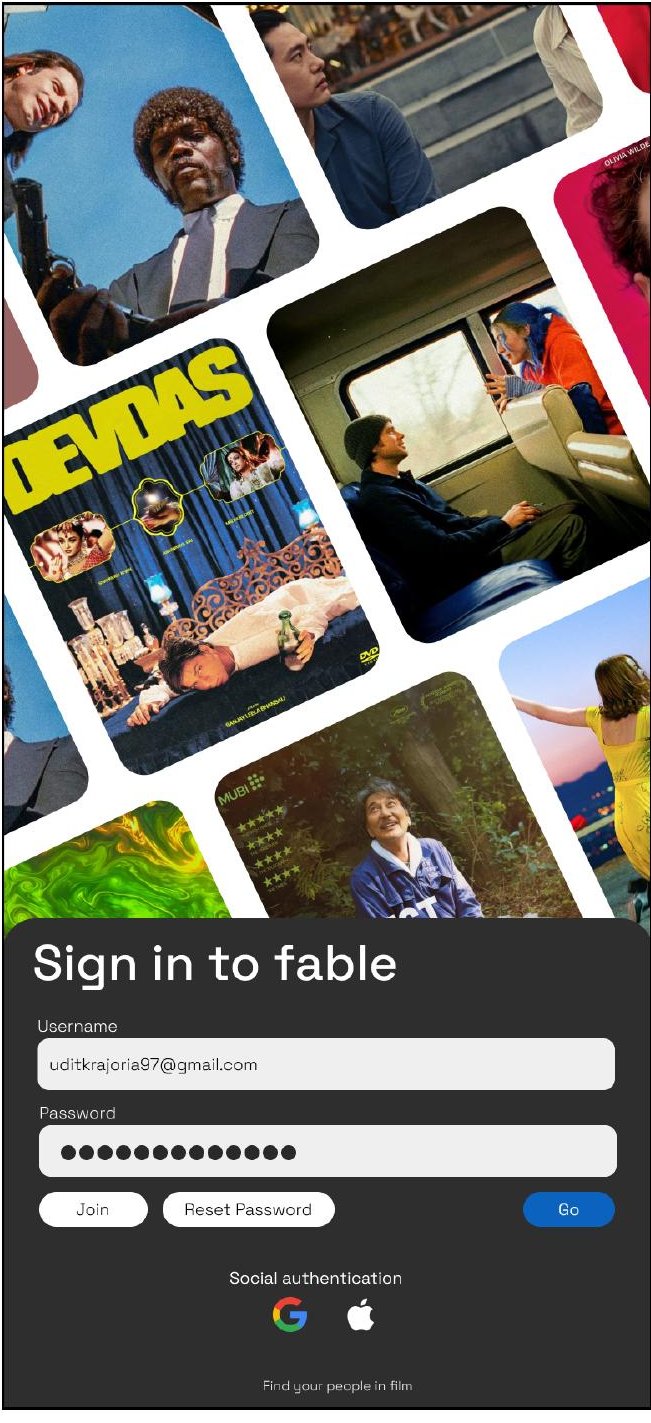
Sign in
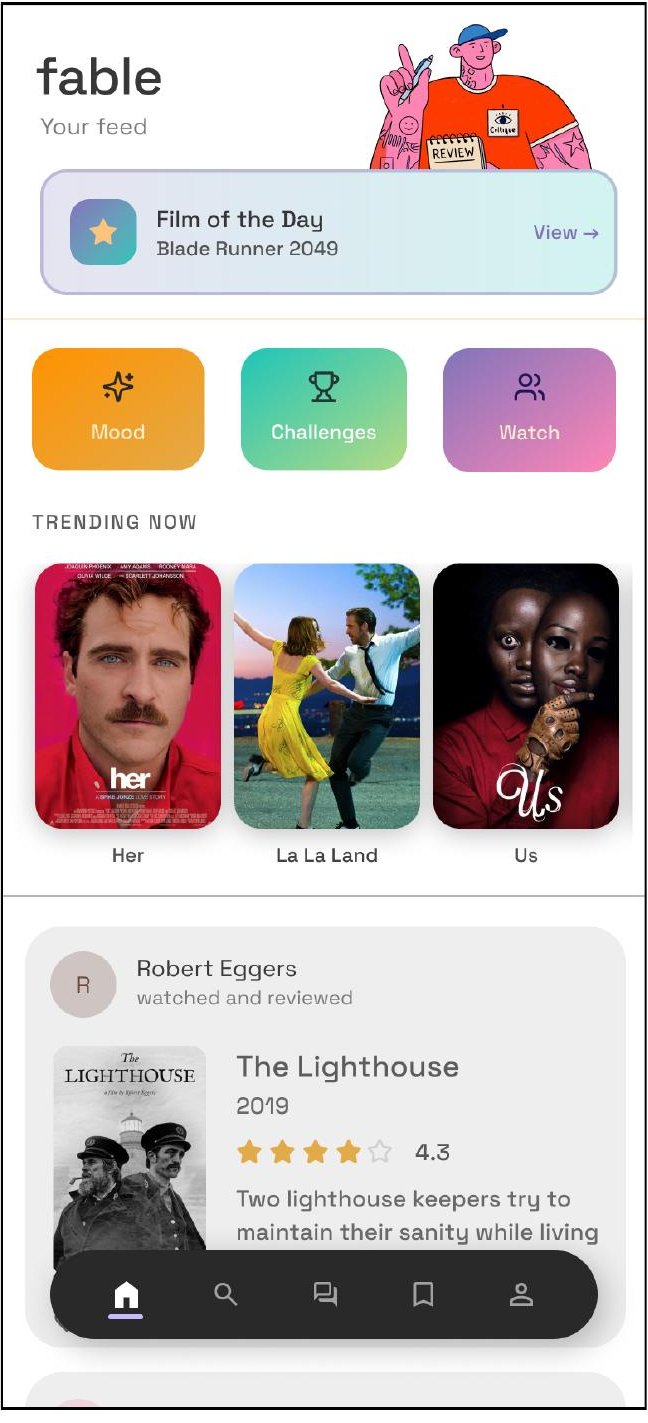
Home feed
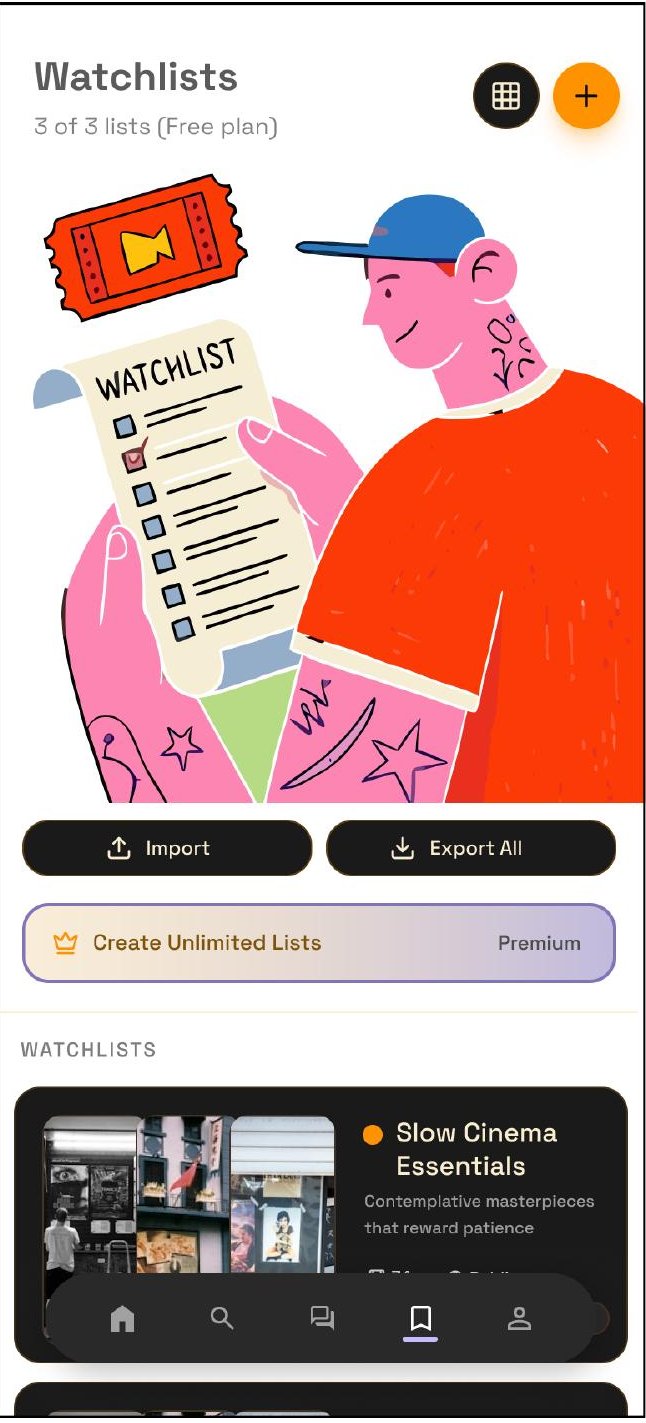
Watchlists
INFORMATION DESIGN
EXHIBITION PLANNING : An interactive timeline for exhibition planning, built as an editorial data visualisation. Hover any task to see its dates and duration, click to trace what feeds into it and what follows, filter by discipline, and press play to watch the schedule unfold week by week. The design makes one point clear at a glance: a strong exhibition build is overlapping and compressed, not sequential.
COURIER DELIVERY TIME DISTRIBUTION — an interactive dot plot comparing four delivery services, where every dot is a single delivery placed by its time in minutes. It reveals at a glance what averages hide: Express is fast and tightly clustered, Economy runs slow and scattered up to 78 minutes, and Standard and Scheduled each carry one late outlier. Hover a dot for its rank and reading, switch to the beeswarm view to see where deliveries pile up, or reveal medians and spread to compare consistency across services.
BOOKSTORE SALES BY CATEGORY SHARE — an interactive Marimekko chart where every block is one book category in one store, sized by its share of sales. Column width shows how much each store contributes to the ₹55,000k total, while segment height shows the category mix inside it. The pattern is immediate: most stores lean on Fiction and Non-fiction, Dwarka runs on Non-fiction and Children's books, and Lajpat Nagar is the lone store where Academic titles dominate — a case for stocking each branch to its own demand rather than uniformly. Hover any block for its exact value, or click a store or category to compare across the chain.
VISITORS IN MUSEUM HIERARCHY : An interactive visualisation exploring the distribution of visitors across museum sections and individual exhibits, with hover interactions, detailed tooltips, comparative popovers, and section-based exploration.
INTERACTION DESIGN
Designing interactions that feel intuitive, responsive, and quietly guide users without getting in their way.
Featured project
fable
A space for every film voice
An end-to-end concept for a taste-driven, social film app,
from a 28-person survey and two personas through to
information architecture, wireframes and final UI.
UX Research
Product Design
Mobile App
Design System
View Case Study
Welcome
Sign in
Home feed
Watchlists
INFORMATION DESIGN
EXHIBITION PLANNING : An interactive timeline for exhibition planning, built as an editorial data visualisation. Hover any task to see its dates and duration, click to trace what feeds into it and what follows, filter by discipline, and press play to watch the schedule unfold week by week. The design makes one point clear at a glance: a strong exhibition build is overlapping and compressed, not sequential.
COURIER DELIVERY TIME DISTRIBUTION — an interactive dot plot comparing four delivery services, where every dot is a single delivery placed by its time in minutes. It reveals at a glance what averages hide: Express is fast and tightly clustered, Economy runs slow and scattered up to 78 minutes, and Standard and Scheduled each carry one late outlier. Hover a dot for its rank and reading, switch to the beeswarm view to see where deliveries pile up, or reveal medians and spread to compare consistency across services.
BOOKSTORE SHARES BY CATEGORY SHARE — an interactive Marimekko chart where every block is one book category in one store, sized by its share of sales. Column width shows how much each store contributes to the ₹55,000k total, while segment height shows the category mix inside it. The pattern is immediate: most stores lean on Fiction and Non-fiction, Dwarka runs on Non-fiction and Children's books, and Lajpat Nagar is the lone store where Academic titles dominate — a case for stocking each branch to its own demand rather than uniformly. Hover any block for its exact value, or click a store or category to compare across the chain.
VISITORS IN MUSEUM HIERARCHY : An interactive visualisation exploring the distribution of visitors across museum sections and individual exhibits, with hover interactions, detailed tooltips, comparative popovers, and section-based exploration.